
There are a lot of different AV tool kit applications developed for the Android and Apple markets that address just about every A/V need. From lighting to audio, and everything in between, you can guess they have an app for that. However, there are also a lot of apps that are fine-tuned for a specific purpose. Whether you are measuring a throw distance for a specific brand of projectors or trying to measure the decibel output of a newly staged speaker system, purpose-specific apps are out there and most of them are very accurate.
The following contains thirteen Android and Apple audio apps for audio spectrum analysis. These apps cover a range of audio measurements, some measure RTA and others FFT, they also range in data presentation – some display 2-D graphs, both logarithmic and linear, and others display 3-D content with waterfall graphs. Regardless of the differences, similarities or unique qualities of each of these apps, they are designed with the A/V professional in mind.
Audalyzer by Moonblink
Audalyzer
Moonblink
Cost: Free
Rating: 4.3
Requirements: Android 1.6 and up
The Audalyzer app is developed to display waveform, frequency spectrum, sonagram and VU meter. The db levels are dependent on the microphone range of your Android device.
bs-spectrum
bs-spectrum by Bismark
Bismark
Cost: $3.99
Rating 4+
Requirements: iPhone, iPod touch, and iPad.Requires iOS 4.3 or later
Display calculated FFT data as a graph with the bs-spectrum app from Apple. Audio data is displayed in both linear and logarithmic measurements.
Features Include:
- Mode: Linear, Logarithmic
- Window: Rectangle, Hamming, Hanning, Blackman
- Decay: 250[ms], … 4[s]
- Amplitude Offset
FFT
Audia Sound
FFT by Audia Sound
Cost: $9.99
Rating: 4.7
Requirements: Android 2.3 and up
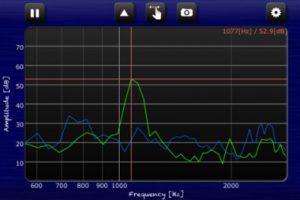
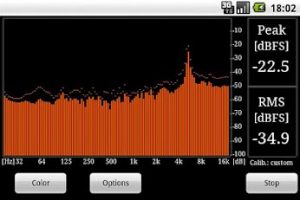
The FFT app for Android was designed for live sound engineers. It offers real time audio analysis mic calibrations with both linear and logarithmic measurements. This app allows you to save graphs and later overlay multiple graphs and measure live sound over top to compare different sets of data. There are multiple color and display options for use in any environment regardless of light level.
Features Include:
- Logarithmic or Linear scale
- Fast freeze button
- Averaging: exponential, flat, and infinite
- Peak Hold, configurable
- Peak frequency finder (full range or visible only)
- Frequency markers
- Snapshots: creating, viewing, and overlaying them
- User-configurable microphone calibration
- Configure FFT Size and Window type (Size up to 16384; 7 window types supported)
- Full control of app colors
- Pinch-to-zoom, one-finger panning and zooming
- Smooth, immediate response to touch
- Continuously updates – never choppy
FFT
FFT by Studio Six Digital
Studio Six Digital
Cost: $24.99
Rating: 4+
Requirements: iPhone, iPod touch, and iPad.Requires iOS 3.1.2 or later
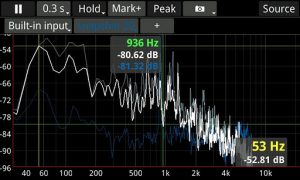
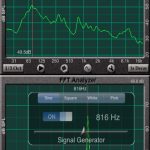
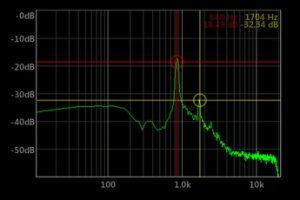
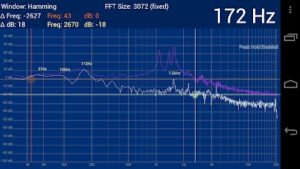
The FFT app from Apple displays a detailed high resolution graph of incoming audio data measured as frequency versus amplitude. The app features graph smoothing for octave adjustment, parameter adjustment, peak tracking, and customizable decibel parameters. You can also save previously made graphs and calibrate the audio input for both internal audio (built-in mic) and external microphone (audio signals via the 1/8-inch input jack). The app also features a signal generator.
iGram Spectral Analyzer
idroidbot
iGram Spectral Analyzer by idroidbot
Cost: $1.99
Rating: 4.1
Requirements: Android 2.1 and up
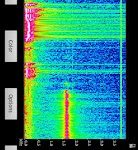
The iGram Spectral Analyzer app for Android is developed to display gram data from real-time audio. This app is useful for musicians, sound engineers, even radar or signal processing engineers.
Features Included:
- Selectable sample rates and FFT size
- Matlab like colormaps
- Two crossbars for easy readout and calculating the deltas
- Records data for playback. The recorded data can be outputted to file or socket
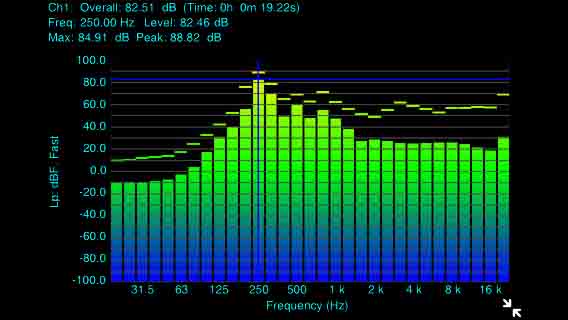
RTA Pro Analyzer by RadonSoft
RTA Pro Analyzer
RadonSoft
Cost: $5.49
Rating: 4.3 stars
Available on: Android 1.6 and up
The RTA Pro Analyzer turns your Android device into a professional audio analyzer with up to 120 bands. With this app you can add 1/4, 1/6 and 1/12 analysation band spacing with up to 120 bands, scalable peak holds and more colour schemes. It also permanently stores calibration data.
SignalScope Pro by Faber Acoustical, LLC
SignalScope Pro
Faber Acoustical, LLC
$74.99 (iOS)
Rating 4+ (iOS), 4 Stars
Requirements – iPhone, iPod touch, iPad, iOS 4.0 or later.
Real-time system analysis is the difference between seamless setup and stressful scrambling. Faber Acoustical has delivered an amazing app, SignalScope Pro, that provides an amazing range of tools all in one. Capture data from your system using audio inputs, as well as accelerometer readings; export that data using a variety of plaforms for review and best practice purposes at a later time.
Features Included:
- Audio input sampled at 48 kHz or 44.1 kHz, while accelerometer data is sampled at 100 Hz
- High-resolution display images can be shared through built-in photo album
- Octave-band analyzer, with variable frequency weighting options
- Stereo, tone signal generator for system testing
SpecScope Spectrum Analyzer by NFX Development
SpecScope Spectrum Analyzer
NFX Development
Cost: $0.99
Rating: 4.4
Requirements: Android 2.2 and up
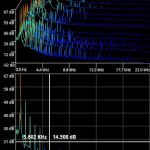
The SpecScope Spectrum Analyzer app for Android measures frequencies from 10kHz to 22kHz in both linear and logarithmic measurements. The app’s UI is specifically developed to maximize the usage of each specific Android device. there are four different window options and the app features multiple ways to zoom, mark and navigate the graph during measurements and when the app is paused.
Features Include:
- Logarithmic/Linear measurements
- Pinch to zoom in both X and Y axis
- Simply navigate round the graph by dragging
- Selectable No. bin for accuracy versus speed
- Three settings of spectrum averaging
- Four different windowing options
- Threshold trigger to hold the peak value
- Tap to pause and resume measurements (graph is still navigational in this mode)
- A adjustable sample rate allow analysis from 10 Hz to 22KHz
- Optional measurement markers for ease of reading
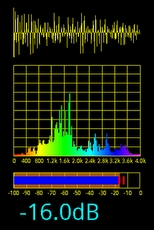
Spectral Audio Analyzer by RadonSoft
Spectral Audio Analyzer
RadonSoft
Cost: Free
Rating: 4.2Requirements: Android 1.6 and up
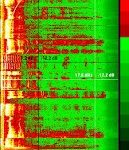
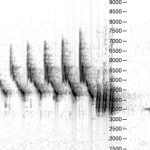
The Spectral Audio Analyzer app for Android displays sound as a colored spectrogram. Measure environmental noise or test your speakers with up to 8 kHz of frequency bandwidth. View patterns and unwanted noise via the apps colored display—all you need is an Android device with a working microphone.
SpectralPro Analyzer by RadonSoft
SpectralPro Analyzer
RadonSoft
Cost:$5.49
Rating: 4.2 stars
Available on: Android 1.6 and up
With Spectral Pro, display live audio as a colored spectogram. The app has selectable frequency up to 24 kHz, with flexible amplitude and frequency mapping through touch and scroll, different update speeds, and color mappings.
Spectrogram by Pete Schwamb
Spectrogram
Pete Schwamb
Cost: $9.99
Rating: 4+
Requirements: iPhone, iPod touch, and iPad.Requires iOS 4.3 or later
Display real time captured audio as a waterfall spectrogram with the Spectrogram app from Apple. The app can use the built-in microphone or an external microphone via the Apple devices 1/8-inch input jack.
Features Included
- Adjustable sensitivity
- Multiple colormaps
- Analyze frequencies up to 20kHz
- 256 to 2048 FFT window size
- Logarithmic or Linear frequency axis
- Frequency scale can be toggled on/off
Speedy Spectrum Analyzer by Electron Chaos
Speedy Spectrum Analyzer
Electron Chaos
Cost: $4.99
Rating: 4.7
Requirements: Android 1.6 and up
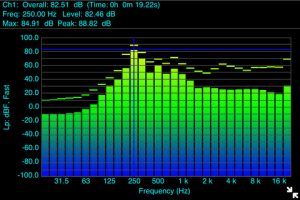
The Speedy Spectral Analyzer app for Android displays audio content on two different frequency axises, logarithmic and linear. The display is very customizable with different options for zoom and graph coverage. You can even measure frequency peaks and valleys—covering a frequency range of up to 22kHz. This app also is capable of saving graphs and sharing screenshots.
Features include:
- Both Logarithmic & Linear frequency axis
- Pinch to zoom in on any signal section
- Pan (vertical and horizontal) by simply dragging the screen
- Dynamically adjusting FFT size, up to 16384 bins (for 2-3 Hz accuracy), based on the optimal size for your screen
- Exponential averaging (adjustable)
- Peak hold overlay
- Share screen snapshots easily
- Range set – full audio range from 20Hz, up to 22kHz.
- Peak & valley measurements with crossbar tools
- Adjustable dB levels for ceiling / floor
- And more
Waterfall Spectrum Analyzer by idroidbot
Waterfall Spectrum Analyzer
idroidbot
Cost: $2.99
Rating: 3.8
Requirements: Android 2.1 and up
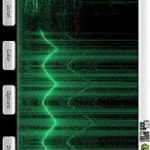
The Waterfall Spectral Analyzer app for Android displays audio content in real-time 3-D spectrogram waterfall. The app can display multiple FFT spectrum at the same time with FFT sizes up to 44100 samples. The app can also display a 2-D spectral graph if the waterfall graph is not convenient.
Features Include:
- Two graphical displays: 3D Waterfall and 2D spectral graph
- Fast and accurate: Tested on Droid X with max sample rate of 48kHz with FFT size of 44100, which equates to 1.0 Hz per bin
- Zoom in and out capabilities for high data resolutions
- Abilities to save and playback recorded data to and from file
- Able to transmit recording data over TCP
- Five well know Matlab colormaps to choose from
- Eight standard windowing functions
- Abilities to save settings to avoid redundancy upon next start up